4.0 Release Notes
These Release Notes are for FH Analytics 4.0 and provide a listing of the enhancements implemented during this release.
The following enhancements were implemented this release.
On the Admin tab, you can now filter out longer-than-normal response times from your data using the new Max Response Time Limit information pane. By filtering out aberrant response times, you can get a more accurate picture of your typical response times.
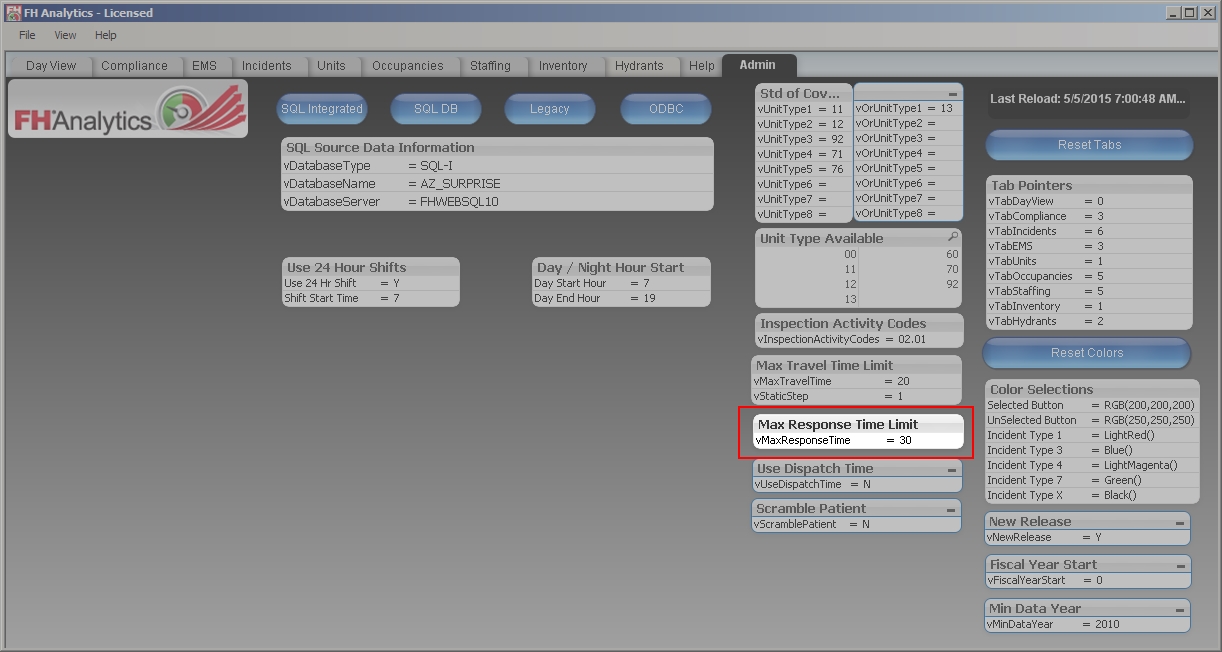
Information on using this new feature is available in Specify administration options.
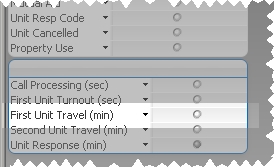
You can now obtain the travel time for the first unit to the incident, as opposed to the travel time for all the units, by using the new First Unit Travel (min) filter.
The filter is located on the Compliance > Dashboard screen in the lower left corner, in the extra filters for the screen.
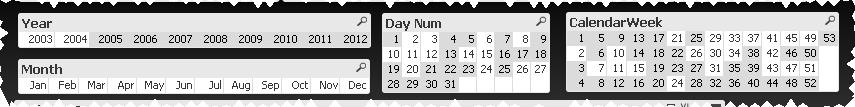
On most tabs, in the calendar panes at the top center of the interface, gray shading has been added to indicate time ranges that have data.
|
Example: In the Year, Day Num, and Calendar Week information panes in the graphic below, the years, dates, and weeks that have data associated with them are highlighted with gray shading. Years, dates, and weeks that have no data are shown as white.
|
On most tabs, in the upper right corner of the interface, you can now filter data by specifying a date range using the Use Date Range button.

Information on using this button is available in Filter your data.
On the Day View > Summary tab, the data in the information panes is now displayed in a more graphical percentage bar instead of as just numbers.
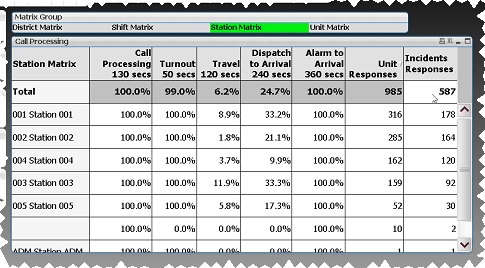
On the Compliance tab, the Unit Matrix, Station Matrix, and Shift Matrix tabs have been consolidated into a single Matrix tab. On the new Matrix tab, you can use the new Matrix Group information pane to switch between different matrices as needed.
The following issues were successfully resolved this release.
On the Units tab, when you selected Day of Week on the right side of the information pane, the pane only displayed data for Monday through Saturday. Sunday data did not appear, and you could not widen the pane or scroll to display more data.
On the Compliance tab, when you clicked the Unit Matrix, Station Matrix, and Shift Matrix tabs, the percentages displayed in the corresponding information panes were not calculated correctly.