3.0 Release Notes
These Release Notes are for FH Analytics 3.0 and provide a listing of the enhancements implemented during this release.
The online documentation has been enhanced by implementing the use of thumbnail graphics, linked to larger versions of the same graphic.
To use this new feature in online documentation, do the following.
-
(When you find a small graphic with a red border around it in the online help) Click the thumbnail graphic.
A full-size version of the graphic appears in a pop-up window over the online help.
- Close the pop-up window by clicking the help web page outside the pop-up window.
Note: Because PDF files are static and quickly become out-of-date, and because online help can be updated rapidly to meet customer needs, this release marks the end of PDF files for FH Analytics documentation. Please see http://www.firehousesoftware.com/webhelp/FHAnalytics/Default.htm for the most current FH Analytics information.
On the Compliance tab, a new sub-tab named Dashboard now appears, which displays the 90th percentile for call processing, turnout times, travel times, and total response times, for the date range you specify.
This new tab provides a more detailed display of the information than is available on the Compliance sub-tab, in the lower right corner, in the 90% Goals information pane.
Note: The Incident Compliance tab has been renamed Compliance in this release.
On the Compliance tab, new Unit Matrix, Station Matrix, and Shift Matrix sub-tabs now appear. On these sub-tabs, you can view statistics for each unit, station, and shift, respectively, in the time period that you select.
Example: If you click the Unit Matrix sub-tab, select 2012 and April as the time frame, the Unit Matrix information pane displays performance statistics for each unit for the department.
Tip: You can sort the data in ascending and descending order according to a specific column by double-clicking the column title.
If you are already using the FH Cloud with your FIREHOUSE Software installation, you now have the option to have FH Analytics installed on the FH Cloud instead of on a local computer. With FH Analytics installed on the FH Cloud, you can access FH Analytics from anywhere using a web browser on a mobile device such as a notebook, iPad, or smart phone. FH Analytics can analyze data in FH installations on the FH Cloud, and can display it to you anywhere you have an Internet connection.
When FH Analytics is installed on the FH Cloud, the FH Cloud administrators set up the connections to your database. As a result, on the Admin tab, the SQL Integrated, SQL DB, Legacy, and ODBC buttons and corresponding source data information pane do not appear for you to make connections with.
On the Admin tab, under Use 24 Hr Shifts, you can now elect to use a 24-hour shift, and you can specify when the 24-hour period begins.
Example: In Use 24 Hr Shift, if you type Y, and then in Shift Start Time you enter 7, shift reports start at 7:00 a.m., and go through 6:59:59 a.m. the next morning.
On the Admin tab, under Color Selections, you can now specify colors for several categories of incidents. The colors you assign for the categories appear on the Incidents tab, Maps sub-tab as colored location dots, to help you quickly identify where different types of incidents are occurring geographically.
The incident type colors represent the following categories of incidents:
- Incident Type 1 = Fire (100-series incident codes)
- Incident Type 3 = EMS (300-series incident codes)
- Incident Type 4 = Hazmat (400-series incident codes)
- Incident Type 7 = False (700-series incident codes)
- Incident Type X = Other (Any other series of incident codes)
Information on assigning colors to incident categories is available in Specify administration options.
On the Admin tab, in the Color Selections information pane, using the new vStaticStep field, you can now change the number of minutes between tick marks for specific information panes.
The information panes affected by the setting in this field are:
- On the Compliance tab, Dashboard sub-tab, the Travel Time Mins - All Units information pane.
-
On the Compliance tab, Compliance sub-tab:
- Travel Time Mins - All Units information pane
- 1st Unit Arrival Compliance (Minutes) information pane
- 2nd Unit Arrival Compliance (Minutes) information pane
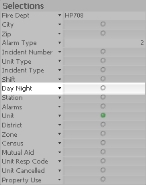
On the Day View tab, on the left side of the interface, under Selections, there is now a new filter called Day Night. This filter lets you view data by the number of hours defined (on the Admin tab) as "night" hours and the number of hours defined as "day" hours. This filter is useful when you have the same shift working across a day and a night, and you want to break down the incident information according to the time of day incidents occurred in.
FH Analytics now exclusively supports Google Maps technology for displaying locations on maps in FH Analytics. As a result, on the Admin tab, the Map Provider information pane no longer appears.
Note: Locations in the FH database must include latitude and longitude values to display on the FH Analytics maps.
On the Admin tab, the vertical Day Night Hour Start slider no longer appears.


